World Cup Third-Place Games Are Not Always Higher Scoring. Modern Ones Are.
The folklore says World Cup third-place games are always a goalfest. All-time, bronze matches and finals average almost the same goals. The real pattern starts in the modern low-scoring knockout era: since 1990 the bronze game stays open while finals and semis tighten.
1990-2022
1990-2022
1990-2022
near parity
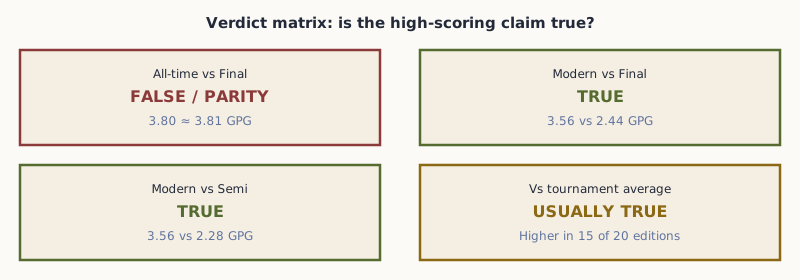
1. Is the high-scoring claim true?
Popular commentary treats the bronze match as a perpetual open game: loose, almost a friendly. Wikipedia’s third-place page calls it “generally a high-scoring affair,” noting that no men’s third-place game has finished under two goals since Poland’s 1-0 over Brazil in 1974. Neutrals get told to tune in for goals.
The careful version needs a comparator. Higher than what?
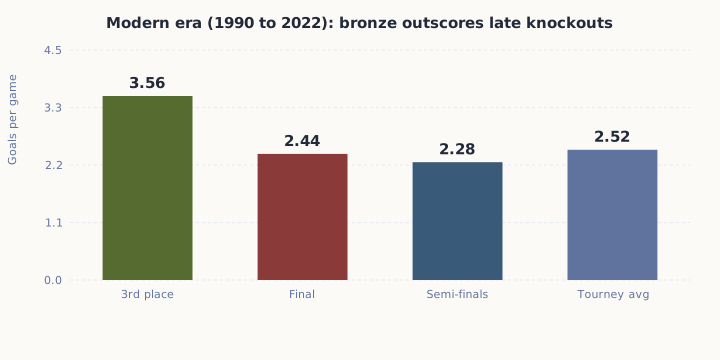
Modern bronze games sit well above finals, semis, and the tournament average.
All-time: the myth meets Opta
Across 20 men’s World Cup third-place play-offs (1934, 1938, and every edition since 1954), there have been 76 goals, or 3.80 per game. That matches Opta Analyst. Across 21 standalone finals, the final sits at about 3.81 goals per game. All-time, bronze and gold are statistical twins.
That fact kills the lazy theory that bronze games score more simply because “nobody defends.” The game with everything on the line has historically leaked just as many goals, often through nerves, open transitions, and high quality rather than indifference.
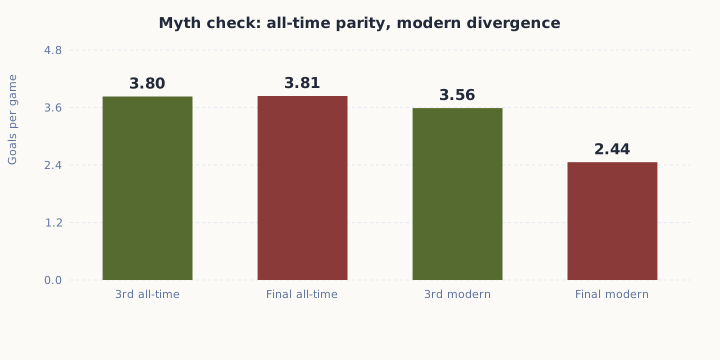
Modern era: the claim becomes true
Split the sample at 1990 and the picture flips. From 1990 through 2022:
- Third place: 32 goals in 9 games → 3.56 GPG
- Final: 22 goals in 9 games → 2.44 GPG
- Semi-finals (sample): about 2.28 GPG
- Whole-tournament average: about 2.52 GPG
Modern finals became cage matches (1990 1-0, 1994 0-0, 2006 1-1, 2010 1-0, 2014 1-0), then reopened in 2018 and 2022. Third-place games never joined the low-scoring winter. They stayed in the 2-5 goal band.
Same-year pairing: third place outscored that year’s final in 10 editions, matched it twice, and trailed eight times. Mean difference is small all-time (+0.10), but the modern gap is structural, not noise.
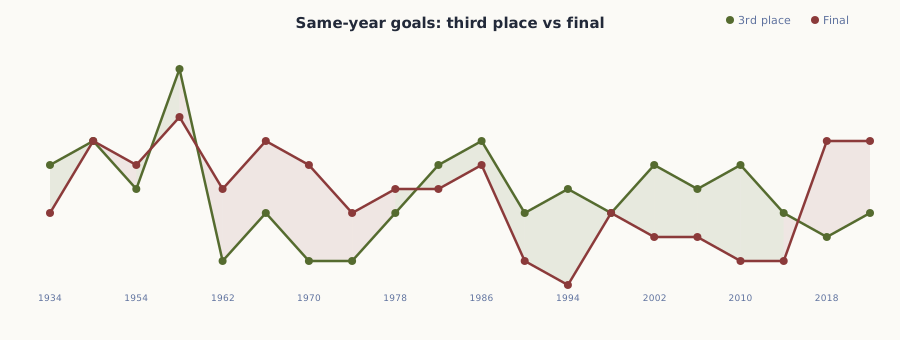
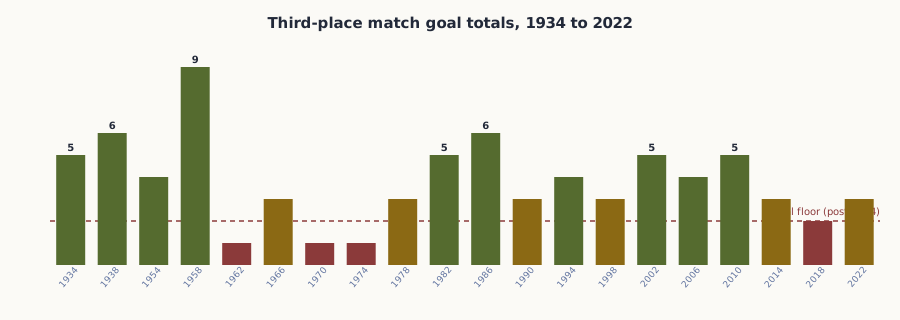
Since 1974, every bronze game has produced at least two goals. Four of the last seven (from 1994) hit four or more.
Floor effect
No men’s bronze match under two goals since 1974. The “goalfest” story has a hard floor even when it is not a shootout.
Vs tournament average
Third place beat that edition’s overall GPG in 15 of 20 years. The excess is largest in tight modern Cups (2010: +2.7).
Counterevidence
All-time parity with finals. Early 1-0 bronzes (1962-74). Managers often publicly hate the fixture.
2. What the numbers say about “openness”
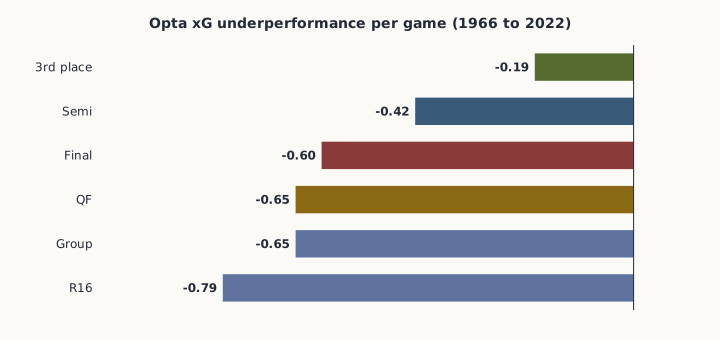
Goals alone can mislead. Opta’s expected-goals read (1966-2022, excluding own goals) shows third-place games produced 50 goals from 52.8 xG, a mild underperformance of about −0.19 per game. That is the smallest shortfall of any World Cup round. Finals underperform by about −0.60 per game; last-16 matches by −0.79.
Translation: bronze games convert chance quality almost normally. Finals and early knockouts leave more goals on the table, consistent with choke, ultra-conservative game states, and inspired goalkeeping under maximum stakes.
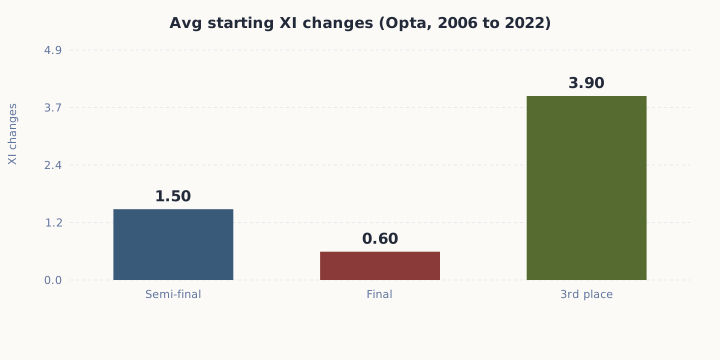
Lineup policy reinforces the openness story without requiring players to “not try.” From 2006-2022, managers averaged 3.9 starting XI changes for the third-place match, versus 1.5 into a semi-final and only 0.6 into a final. Fringe attackers, backup full-backs, and less rehearsed defensive units share the pitch. That is not pure exhibition chaos. It is a designed reduction in continuity that raises variance and, historically, goals.
3. Psychology and strategy: why the game opens up
A. Asymmetric stakes after the semi-final
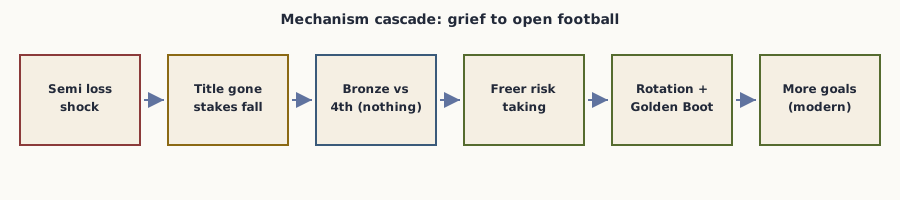
Both teams arrive having just lost the match that mattered most. The World Cup is gone. What remains is ordinal pride: third versus fourth, bronze medals versus none, a modest prize-money bump, ranking points, and a last televised ninety minutes of a career-defining summer.
Prospect theory predicts people weigh losses more heavily than equivalent gains. Here the catastrophic loss already happened in the semi. Relative to that reference point, the bronze match is a small gain domain. Teams can take offensive risk without reopening the wound of elimination. The cost of a mistake is no longer “we are out.” It is “we finish fourth instead of third.”
B. Counterfactual emotion: bronze versus silver
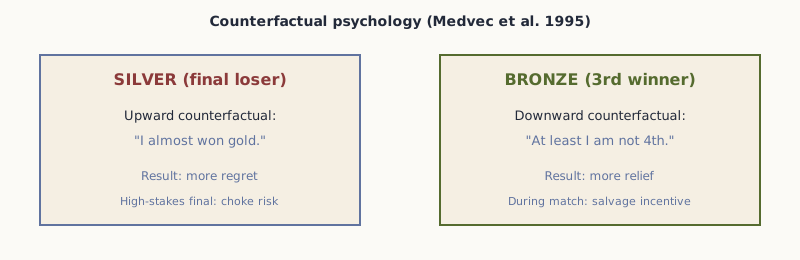
Medvec, Madey, and Gilovich’s 1995 study of Olympic medalists found bronze medalists often looked happier than silver medalists. Silver invites an upward counterfactual (“I almost won”). Bronze invites a downward one (“I almost left with nothing”). The third-place playoff literature cites the same pattern for playoff bronze winners versus final losers.
That research is about post-event affect, but it maps cleanly onto in-match motivation: the bronze game is the live opportunity to secure the “at least we got something” story. Fourth place is pure void. That discrete cliff (medal vs no medal) is sharper than the continuous gap between first and second once the final is under way.
C. Reduced defensive obligation, not zero effort
The folklore says players stop defending. The data says they stop defending as if a single error ends a lifetime goal. Finals compress risk: one transition can write history. Bronze games still have professional pride (Croatia 2022 celebrated like a title; Germany 2006 treated the home bronze as a national event; Turkey and South Korea 2002 both wanted the podium).
But the optimal strategy tilts toward initiative. Sitting deep for a 0-0 that might go to extra time is less attractive when everyone wants the plane home. The third-place match has never gone to penalties and only once to extra time (France 4-2 Belgium, 1986). That is consistent with teams preferring open resolution over attritional stalemate.
D. Individual incentives punch above team stakes
Goals in the bronze game count for the Golden Boot. Fontaine’s four in 1958 sealed a still-standing 13-goal tournament record. Schillaci (1990), Šuker (1998), and Müller (2010) padded winning tallies here. Eusébio scored in 1966. Attackers have a private reason to stay vertical even if the collective mood is flat. That misalignment (team grief, striker ambition) is a feature of open games.
E. Money is real, the delta is small
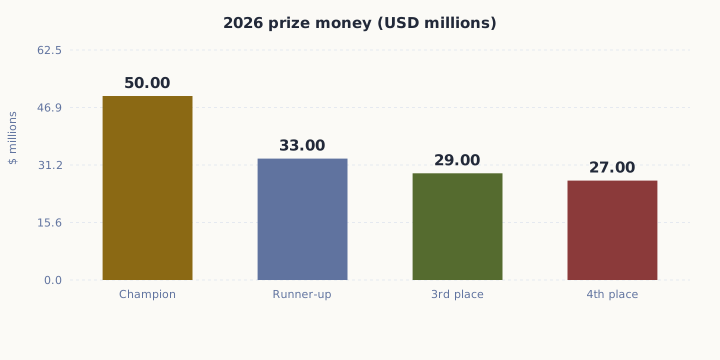
In 2026 reporting, third place sits near $29 million and fourth near $27 million (Athletic prize breakdown). Champions take about $50 million. Two million dollars is not nothing for federations, yet it is a rounding error beside the reputational gap between finalist and also-ran. Money keeps the fixture from pure farce. It does not explain a +1 goal gap versus modern finals. Pride, medals, rankings, and individual awards do more work.
F. Heterogeneous motivation
Match histories show uneven seriousness. Heavy favorites who “should” have been in the final sometimes rest stars (Platini skipped France’s 1982 and 1986 bronze games). Cinderella sides treat bronze as history (Sweden 1994 parade; Croatia 1998 and 2022; Turkey 2002). When at least one side needs the podium narrative, the game stays competitive. When both sides rotate heavily, variance still rises because organization drops.
“I think this match should never be played… The worst thing is that there is a chance you are going to lose twice in a row.” - Louis van Gaal, 2014
“It’s not a game any team wants to play in.” - Gareth Southgate, 2018
Managers’ contempt coexists with watchable football. Players may not want the fixture, yet once it starts, professional identity and public scoreboard take over. The Athletic’s 2026 explainer tracks the same manager quotes and the goalfest reputation for neutrals.
4. Strategy board: what coaches actually optimize
Final optimization
Max continuity (0.6 XI changes). Risk of historic failure dominates. Game states become low-event. Set pieces and transitional moments decide. Underperformance vs xG is large.
Bronze optimization
Reward squad (3.9 changes). Avoid injuries before club season. Win bronze if possible. Let attackers hunt personal tallies. Accept open structure; avoid pointless extra time.
Those two objective functions produce different football even with the same talent tier (both teams were good enough to reach the last four). Semi-finals sit closer to finals on scoring because the prize is still the final itself. Once that prize vanishes, the constraint set changes in a single matchday.
5. Full bronze scoreboard
Complete men’s third-place results, compiled from ESPN’s results list and historical tournament records:
| Year | Winner | Score | Loser | Goals |
|---|---|---|---|---|
| 1934 | Germany | 3-2 | Austria | 5 |
| 1938 | Brazil | 4-2 | Sweden | 6 |
| 1954 | Austria | 3-1 | Uruguay | 4 |
| 1958 | France | 6-3 | West Germany | 9 |
| 1962 | Chile | 1-0 | Yugoslavia | 1 |
| 1966 | Portugal | 2-1 | Soviet Union | 3 |
| 1970 | West Germany | 1-0 | Uruguay | 1 |
| 1974 | Poland | 1-0 | Brazil | 1 |
| 1978 | Brazil | 2-1 | Italy | 3 |
| 1982 | Poland | 3-2 | France | 5 |
| 1986 | France | 4-2 | Belgium | 6 |
| 1990 | Italy | 2-1 | England | 3 |
| 1994 | Sweden | 4-0 | Bulgaria | 4 |
| 1998 | Croatia | 2-1 | Netherlands | 3 |
| 2002 | Turkey | 3-2 | South Korea | 5 |
| 2006 | Germany | 3-1 | Portugal | 4 |
| 2010 | Germany | 3-2 | Uruguay | 5 |
| 2014 | Netherlands | 3-0 | Brazil | 3 |
| 2018 | Belgium | 2-0 | England | 2 |
| 2022 | Croatia | 2-1 | Morocco | 3 |
6. Women’s World Cup: weaker pattern
With fewer editions, women’s third-place games are mixed: several 2-0 or 1-0 results, a 0-0 (1999, pens), and England’s 2015 extra-time win over Germany. The “always a goalfest” slogan is a men’s modern-era story more than a universal football law. Small samples and different competitive density matter. Treat women’s bronze scoring as a separate series, not a confirmation.
7. Synthesis
Third-place World Cup games are not magically higher scoring than finals across history (3.80 vs 3.81). They are reliably higher scoring than modern finals, modern semis, and typical tournament averages, because after semi-final elimination the remaining incentives (bronze vs nothing, medals, modest money, rankings, Golden Boot) reward initiative while lineup rotation and lower choke pressure raise variance and finishing efficiency.
What to believe, ranked
- Strongly supported: modern (1990+) bronze GPG exceeds final and semi GPG; no bronze under two goals since 1974; heavy rotation is real; xG conversion is freer than in finals.
- Well supported: salvage psychology and medal counterfactuals shape motivation; individual awards pull attackers forward; FIFA keeps the game for spectacle, revenue, and classification.
- Weak / false: “always higher than the final”; “players do not try at all”; “money is the main driver of the $2m delta.”
8. What this means for watching
If you want the purest high-stakes chess, watch the final. If you want last-four talent with fewer handbrakes, the bronze match is often the better neutrals’ game in the modern era. Expect rotated XIs, early goals (Sükür’s 11-second record still stands from 2002), and a non-trivial chance of three or more goals. Do not expect both managers to pretend they are happy to be there.
The product on the pitch is a compromise between grief and professionalism, and that compromise, measured carefully, scores.
9. Alternative explanations that fail
“Indifferent defending alone” fails the all-time test: finals match bronze for goals historically. “It’s just an exhibition” fails when hosts and Cinderella nations treat bronze as national memory. “Fatigue makes defending worse” should also suppress attacking coordination; instead xG conversion is cleaner than in finals. “The ball or era scoring environment” cannot explain within-tournament gaps: the same ball and rules produce 1-0 finals and 3-2 bronzes weeks apart.
A better multi-cause model is additive. Start with last-four talent. Remove title stakes. Add rotation. Add private attacker incentives. Add a discrete bronze cliff versus fourth. The sum is modern high-event football without requiring anyone to stop caring.
Do not pool 1958’s 6-3 with 2010’s 3-2 and call it one phenomenon. Pre-1970s football was a different scoring regime. The interesting causal window is post-1990, when knockout football generally tightened and the bronze match refused to follow.
Sources
Score series: ESPN third-place results, FIFA World Cup finals list, third place playoff overview. Analytics: Opta Analyst bronze-game stats. Psychology: Medvec, Madey & Gilovich 1995. Context: Athletic third-place explainer, prize money reporting, BBC Golden Boot note. Men’s World Cup 1934-2022 sample; 2026 bronze result not required for the historical claim.